Abrar Mahmud –
Adani Group has been accused of manipulating stocks and annexing financial documents, according to a recent analysis by the New York-based investment research firm Hindenburg. The report sparked a global uproar that everyone came to know that “Gautam Adani is No Longer Asia’s Richest Man” from The Forbes story on 1st February 2023.
Adani’s net worth decreased from 120 to 56 billion US dollars following the release of the Hindenburg report. It posed 88 questions for Gautam Adani, chairman of the group, to which the Adani Group replied in a 413-page response. Now, was this fully Gautam Adani’s fault? Will only he carry all the liability? Let us find out the answer.
In a typical stock market, businesses can raise money by selling shares of stock or equity to investors, and then paying dividends after a specific term. A typical trader will refer to these stock market activities as “buy & sell” in plain language. However, stock markets are not simply about buying and selling. Investors who take their decisions based on candlestick analysis run a lower risk of losing money in the stock market than do typical traders.
What exactly is this candlestick analysis? It is a type of pattern employed as a tool for financial technical analysis. It shows information about daily price movement that is visually displayed on a candlestick chart. It displays patterns in the movement of derivatives, securities, and currencies.
There are two types of patterns in candlestick analysis:
-
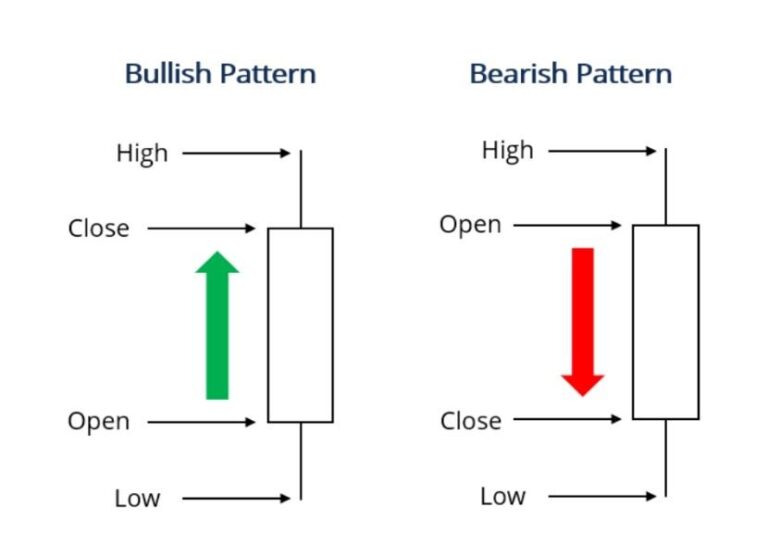
Bullish Patterns: It occurs when a stock’s closing price for the period was higher than its opening price. The possibility of further price appreciation urges the investor to buy.
-
Bearish Patterns: It occurs when a stock’s closing price for the period was lower than its initial price. Due to the idea that the price will decrease, the investor feels instant pressure to sell.
Investors/regulators could have used these patterns against the shares of the Adani group and we wouldn’t need to see the present chaos. Sometimes, the candlestick patterns show a strong mixture of bullish and bearish movements. Analysts stay at a loss for words at this time. Then, the engulfing line of candlestick analysis offers a resolution.
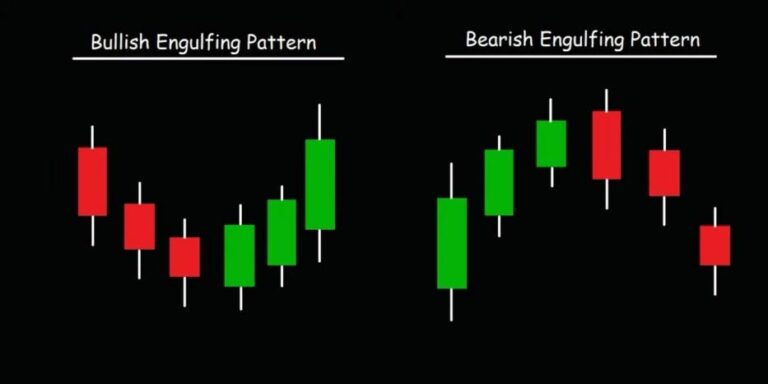
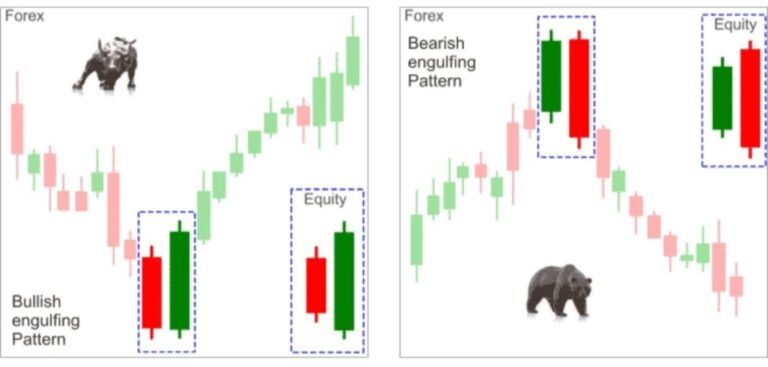
Engulfing Line (EL): It is a sort of candlestick pattern that can appear as a bullish and bearish trend, denoting the continuation of a trend. A bearish engulfing line requires a bullish first candle, a bearish second candle, and for both candles to be “engulfing” the first bullish candle. In contrast, a bullish engulfing line consists of a bearish first candle and a bullish second candle that is “engulfing” the negative first candle.
Harami Candlestick: This is not the regular Bengali slang. Harami means “pregnant” in Japanese, which is demonstrated by the first candle and regarded as “pregnant”. Two candles make up the Harami candlestick, with the first being larger than the other and acting as a “pregnant” line opposite to the engulfing line. Either a prospective price reversal or the continuance of a negative or bullish trend is indicated by this pattern.
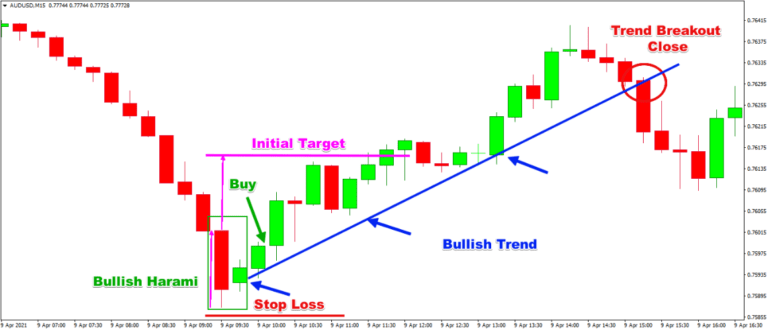
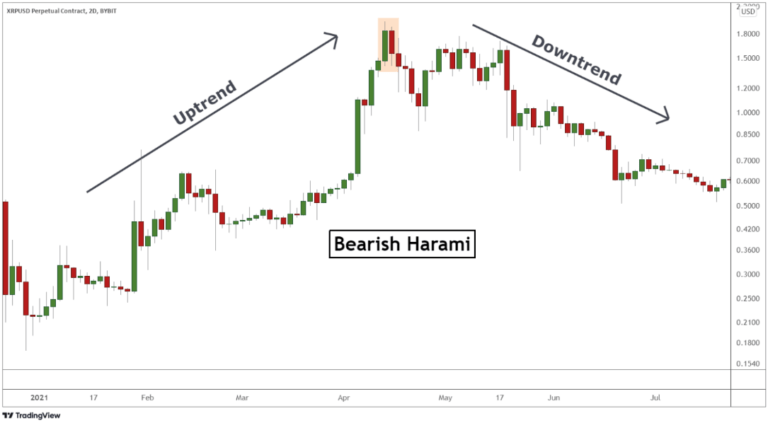
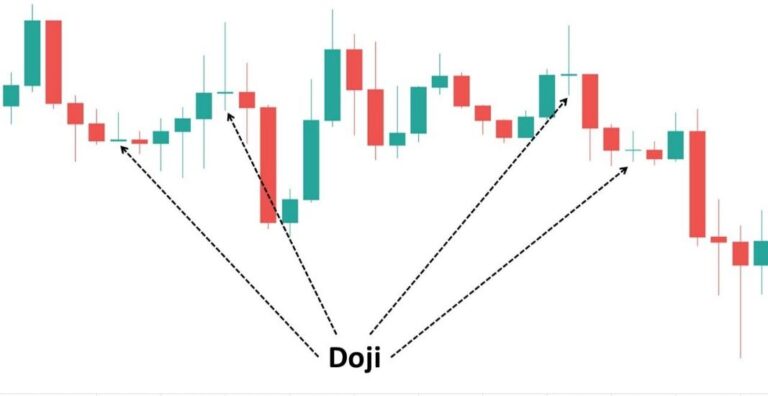
Doji Candlestick: Even after all of this candlestick analysis, an investor may still be unable to decide whether to purchase or sell. The finest counselor for understanding a complex stock market is Doji candlestick analysis. Trading with the Doji candlestick pattern might result in significant returns. All types of traders value this candlestick pattern’s adaptability to various time frames.
When a market’s open price and closure price are almost identical, the Doji candlestick pattern is formed. When the market starts, bullish traders drive prices up, while bearish traders reject the higher price and push it back down, forming this Doji candlestick.
Additionally, it is probable that while pessimistic traders (bears) attempt to drive prices as low as they can, optimistic traders (bulls) may respond by driving the price higher. The wick is created by the upward and downward movements that take place between “open” and “closure”. When the price closes at the same level as it opened, or very close to it, the Doji is created.
With all these candlestick analyses, investors should have dominated the stock market not a share issuer. Let us get to the point now: if any Adani Group investors had performed the aforementioned candlestick analysis, the current group of individuals would not have existed. The price details were always available. When it comes to the stock market, there are typically two sorts of investors:
-
Defensive Investors: They take a defensive stance depending on public opinion. They do not use candlesticks or basic analysis to purchase stocks.
-
Active Investors: They use fundamental and candlestick research to identify mispriced equities.
To reach their goals, firms like Hindenburg target defensive investors. Do not overlook the fact that Hindenburg Research is a short seller. Let us see what a short seller does:
According to Forbes, “By turning the traditional notion of investing on its head, short selling is a sophisticated trading strategy. Going long in the stock market is the practice of purchasing stock to sell it at a later date for a profit. When a trader goes short, or bets against the stock’s future growth, they are selling the stock.”
“To start a short position on a stock, a trader borrows shares from a broker and then sells them right away to other buyers on the open market. The short seller must buy the shares back to conclude the contract, ideally at a lower price to pay back the broker for the loaned funds. If the stock price dropped as anticipated, the trader would earn from the price difference less any costs and interest.”
So, given that short selling is their main source of income, we should not be overly pleased with the Hindenburg report.
Adani Group is now the target of yet another charge: financial statement tampering. To invest in any company, an active investor will undoubtedly perform some ratio research. Adani Group’s annual reports and financial statements were always available. According to the summary of the financial statements of Adani Group as shown below, only Adani Wilmar and Adani Ports have Current Ratios above 1.0, while the other five companies do not. The investors thus had choices.
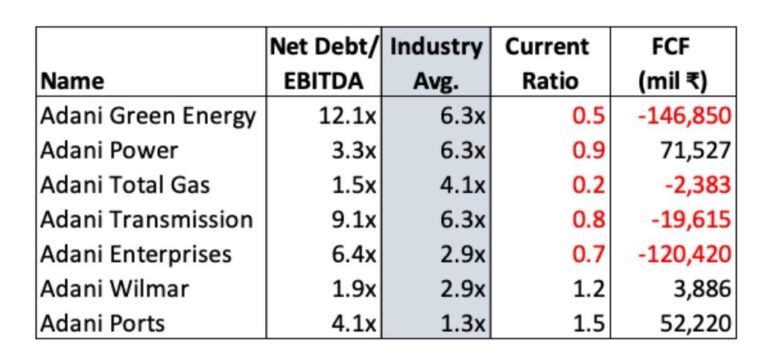
The current ratio is a liquidity ratio that measures a company’s ability to pay short-term obligations or those due within one year. The ratio considers the weight of total current assets versus total current liabilities. Accounting and finance experts use the current ratio as a tool to assess the current state of a company’s finances.
Even if a person is unable to comprehend current ratio analysis, they can still learn about a company’s financial health by looking at the acid test ratio, debt-to-equity ratio, and Price-to-Earnings (P/E) ratio analysis.
The P/E ratio is the ratio for valuing a company that measures its current share price relative to its earnings per share. It is used by investors and analysts to determine the relative value of a company’s shares in an apple-to-apple comparison. It can also be used to compare a company against its historical record or to compare aggregate markets against one another or over time.
Concerns have been raised over Adani’s offshore and shell firms. We should not forget about the 45 tax havens that exist worldwide, including Andorra, Ireland, Luxembourg, and Monaco in Europe, Hong Kong and Singapore in Asia, the Cayman Islands, the Netherlands Antilles, and Panama in the Americas, among others.
Shell firms are acceptable in these safe havens. And it stands to reason that a commercial organization would choose a company in one of such tax havens to increase earnings.
Mispricing of stocks is nothing new. When Dell performed its final split in 1999, it was a little quicker to react since the stock price was around 86 US dollars per share at the time of the final 2-for-1 transaction in 1998. Dell’s shares were trading for a P/E ratio of 87.9 in 2000, compared to the S&P’s 33 at the time. Later, in 2011, Dell’s share price was 14 cents. That was such a downward trend! Then what? Dell died, right? Dell Inc. is still struggling with the business.
A large number of stakeholders’ interests are at stake in a multinational corporation. Therefore, whether making a statement to the media or criticism, one should do so appropriately.
Hindenburg has already acknowledged that they have acquired a short position in the Adani Group Companies through derivatives traded outside of India and U.S.-listed bonds. Only the value of equities traded outside of India is the subject of their report. Therefore, the interested parties might hope that Adani Group would survive.
Investors and decision-makers must perform a proper analysis, and candlestick analysis is one of the best analyses, to comprehend what information, they should act on.
Abrar Mahmud is an undergraduate BBA (Major in Finance) student at the Army Institute of Business Administration, Savar.


